Vigor Medical Systems
COPD patients were dropping out of rehab at home. I designed the patient app and the platform their coaches use, and 84% stayed in the program after three months.
- Role
- Product Design Lead: research, UX and service design
- Tools
- Figma, ProtoPie
- Team
- Providers, a PM and engineers
- Timeline
- 2022 to 2023

The Problem
Nearly two in five older adults with COPD live more than 10 miles from the nearest pulmonary rehab center, so Vigor brought rehab home: an app for patients and a health coach for each of them. Sign-ups were strong, but 40% of patients dropped off within three months.
Coaches were stretched too. Each managed 40 or more patients, answering texts in real time while keeping track of their data in spreadsheets.
How might we help COPD patients stay with their rehab at home?
How might we give health coaches their time back for care?
Research
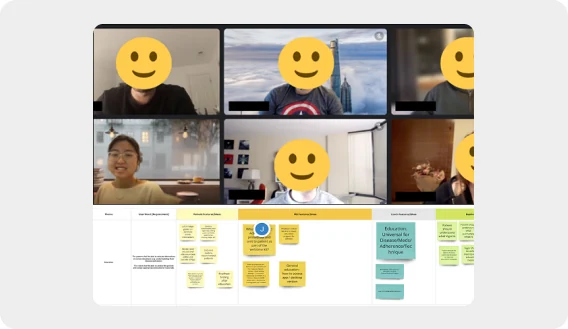
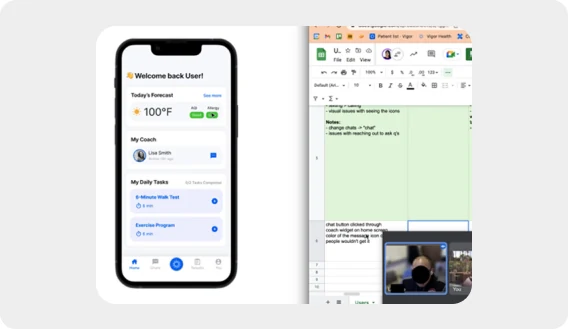
I ran workshops with the CEO, the CPO, pulmonologists, health coaches and operations staff to find the gaps in the service, and usability tests with five COPD patients.
What We Learned
Patients couldn’t see their own progress, so the daily effort was hard to keep up.
Led to: Daily tasks, milestones and progress rings that show how far they’ve come.
Older patients struggled with small buttons and deep menus.
Led to: Larger buttons, a clearer hierarchy and simpler navigation.
Coaches kept patient data in Google Sheets and messaged patients somewhere else.
Led to: One platform for tracking data, logging notes and messaging patients.
Design Decisions
Personal Progress, Not Competition
- Considered
- Points, streaks and leaderboards that rank patients against each other.
- Chose
- Progress rings and milestones that show each patient how far they’ve come from where they started.
- Why
- Patients start rehab in very different places. Ranking them would discourage the ones who need it most; seeing their own progress gave them a sense of control, and that kept them going.
One Task per Screen
- Considered
- A dashboard that shows every task, metric and message at once.
- Chose
- One main task per screen, with larger buttons, a clear hierarchy and simpler navigation.
- Why
- In usability tests, older patients struggled with small buttons and deep menus. Fewer choices per screen made each day’s rehab easy to start.
One Platform for Coaches
- Considered
- Improve the Google Sheets coaches already used, or add a messaging tool beside them.
- Chose
- One platform for tracking patient data, logging notes and messaging patients.
- Why
- Each coach managed 40 or more patients across spreadsheets and texts. Bringing it into one place cut the admin and gave them time back for care.
The Design
Results
These are outcomes of the whole program, the app and coaching together, for about 40 patients over three to six months.
- Patient retention after 3 months
- 84%
- Average increase in daily steps
- 148%
- Reduction in emergency visits
- 40%
“Doctors just don’t have time to go over with every patient. But I can see that Vigor has given me the tools. That made a difference.”
Reflections
- Designing for Coaches Was Designing for Patients
- When we cut coaches’ admin, they had more time for actual care, and that showed up in patient outcomes.
- Connection Mattered as Much as Features
- Patients said they felt better simply from talking to their coach regularly. A reminder to design for connection, not just the interface.
Notes
- American Thoracic Society, 2021: of 10.3 million Medicare beneficiaries with COPD, 38% lived more than 10 miles from the nearest pulmonary rehab center.
- Vigor program data, about 40 patients over 3 to 6 months.