NYU Langone Cardiovascular Risk Hub
Heart risk data is scattered across the EHR, so preventive care gets missed. With SoDEC’s Nudge Unit, I designed the Cardiovascular Risk Hub, a dashboard prototype now in testing with providers.
- Role
- UX Designer: research and UX design
- Tools
- Claude Code, Figma
- Team
- SoDEC’s Nudge Unit: Dr. Adam Berman, Nicole Redfern, April Chien
- Timeline
- 2026 to present
Parts of this project are under NDA, so some screens, data and details are left out or simplified.
 That’s me, presenting!
The Problem
Only 44% of US adults who qualify for a statin to prevent heart disease take one. Part of the reason is the visit itself. To see a patient’s risk, a doctor gathers numbers from across the EHR, enters them into an outside calculator, and checks the result against guidelines that keep changing. It takes time a visit doesn’t have.
“All of my patients’ data is scattered everywhere.”
“There are always new updated guidelines that I need to remember.”
How might we give clinicians a unified view of cardiovascular risk at the point of care?
Research
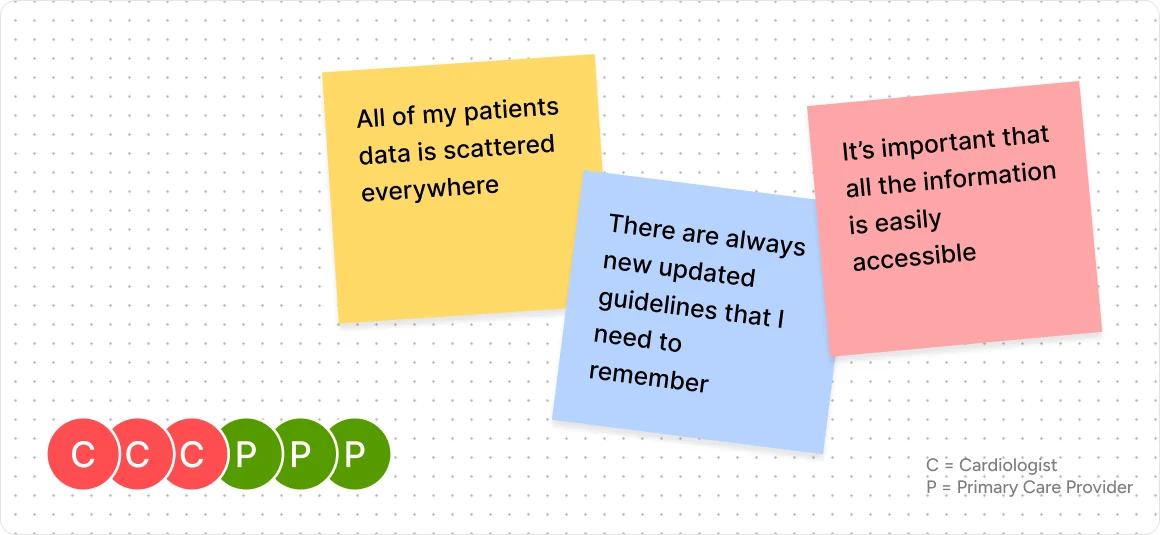
I mapped what providers told us to a nudging framework: for each barrier, the smallest change to the setting that makes the right action the easy one.
Design Decisions
Lead with the Next Step, Not the Data
- Considered
- Open each patient on their risk score and the data behind it.
- Chose
- Open each patient on the recommended next step, with the score and its reasons just below.
- Why
- At the point of care every second counts. A doctor needs to know what to do before why.
Prototype in Code
- Considered
- A clickable Figma prototype.
- Chose
- A working prototype built with Claude Code.
- Why
- Stakeholders clicked through real states rather than pictures of them, so their feedback got specific.
The Design
Next Steps
The Hub is in testing with providers now.
- Test Version 2 with ProvidersFind which layout works best for them.
- Validate the Customized ViewSee whether it meets each specialty’s needs or adds friction.
- Move Toward the EHRMap which data the Hub can pull from Epic.
Reflections
- Frameworks Turned Quotes into Decisions
- Mapping interview themes to nudges gave each design choice a reason clinicians could trust.
Notes
- Anderson TS, Wilson LM, Sussman JB. JAMA Internal Medicine, 2024: 44.1% of US adults eligible for a statin to prevent heart disease reported taking one.